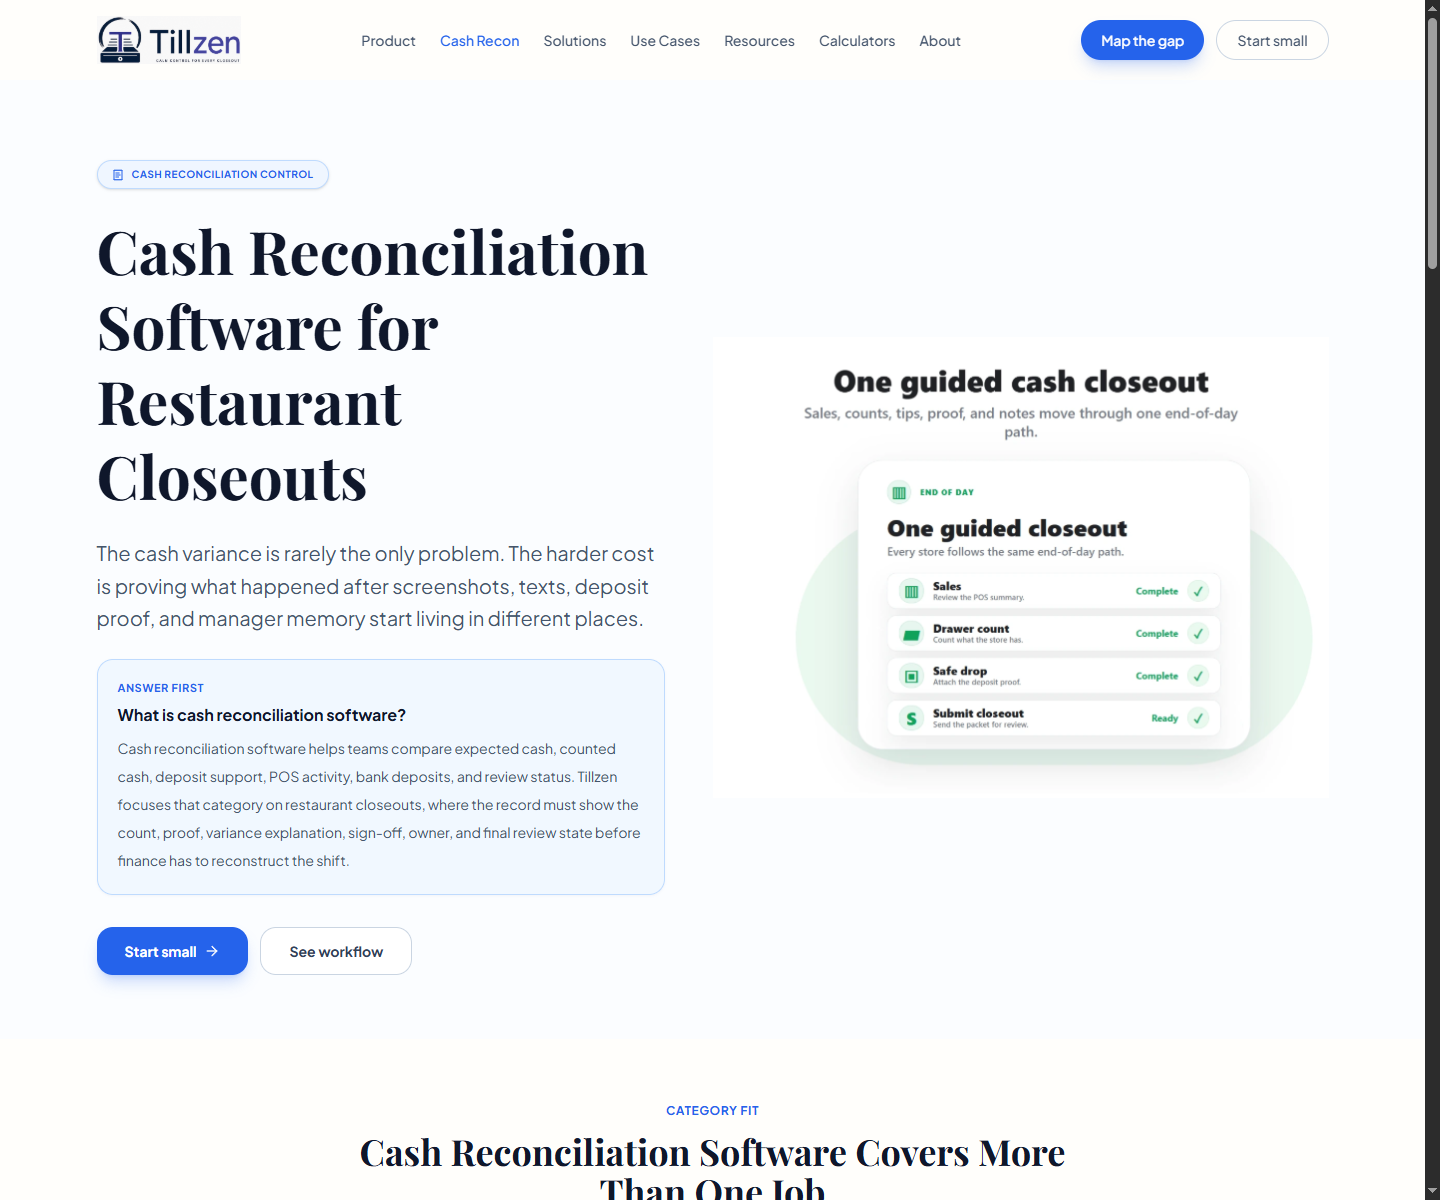
How does the Cash Difference Number Is the Loudest Cost, Not the Only One work?
A restaurant can stare at the over-short total and still miss the real expense. The ten-dollar shortage is visible. The half hour of follow-up is not. The missing receipt hunt is not. The month-end question that starts because nobody preserved the closeout details is not.
That is how closeout drift becomes expensive without looking dramatic. It creates small pieces of work that land on managers, district leaders, finance and advisors after the shift is already cold.
This brief is built to count that work without pretending every cash difference turns into recoverable cash.
- Cash loss is one line.
- Review drag is often the bigger store burden.
- A credible cost case starts with the team's own records.
Do Not Inflate the ROI Story?
A weak ROI article promises a clean number before it has earned one. It says automation saves time, reduces loss, improves accuracy and pays for itself. Maybe. But a finance buyer has heard that before.
The stronger argument is narrower. If a pilot creates more records the team can check on the first pass, reduces missing proof, names owners faster and cuts repeat follow-up, then rollout has evidence behind it. If it does not, the restaurant leader learned that too.
That conservative frame gives finance advisors and restaurant teams a model they can defend.
The practical gap is a cost model for unverifiable closeout records without fake savings claims.
Why Visible Cash Difference Is Not the Cost?
A small shortage can create a large amount of work when the record is unclear. The cash amount is visible. The hidden cost is the follow-up, proof chase, manager interruption, accounting cleanup and delayed review.
That is why the Tillzen business case stays disciplined. The claim is not that every store saves a fixed amount. The claim is that the pilot makes closeout work easier to measure and control.
- Direct open over-short amount.
- Manager and district follow-up time.
- Accounting cleanup caused by missing evidence.
- Repeated review work by store or manager.
How do teams use a Cost Model Without Overclaiming?
A useful cost model uses the team's own records. Count how many records are not easy to check on the first pass. Count how many issues need a second message. Count how many proof questions reach finance.
Those numbers are enough for a credible pilot case. They are also safer than broad ROI language because the buyer can validate the problem in 14 days.
- Measure record completeness before the pilot.
- Track proof and vague-note issues.
- Count follow-up requests from district and finance.
- Review open issues after day 14.
What a Strong Pilot Report Should Show?
A strong report shows whether the record became easier to trust. It should show record completion, proof checks, issue ownership, review latency and whether managers could use the steps without extra administrative drag.
- More records the team can check on the first pass.
- Fewer cases with unclear proof status.
- Cleaner owner assignment for issues.
- A clear decision to roll out, narrow, extend, or stop.
How does measure Paper Cuts Without Fake ROI work?
The paper-cut cost is real, but it should not be inflated. Count repeated shortages, unclear proof, vague notes, second-message follow-up and accounting cleanup apart before making the business case.
This keeps the brief credible for finance buyers. The story is not a universal savings promise. It is a measurable drag that the pilot can surface.
- Count open cash difference dollars apart from follow-up labor.
- Track how often managers are pulled back into old closeouts.
- Log finance cleanup caused by missing daily evidence.
- Review repeated cases by store, shift, drawer and manager.
How does turn Follow-Up Load Into a Pilot Report work?
A strong report shows whether the daily close became easier to check. It should include first-pass record quality, proof issues, owner assignment, review timing and manager adoption.
The cost case should come from the team's own evidence, not broad industry math.
Those measures help finance and operations agree on what changed. If the pilot produces anecdotes, it is not strong enough to justify rollout.
- Show the starting point follow-up load before the pilot.
- Show how many records the team could check on the first pass.
- Show which issues still need manual cleanup.
- Decide to roll out, narrow, extend, or stop.
What should I read next about the Business Case?
Use the accounting guide when the buyer is a controller, CFO, or advisory partner. Use the pilot report guide to turn cost logic into an expansion decision.
- Read /resources/restaurant-accounting-closeout-control-guide for finance handoffs.
- Read /resources/hidden-roi-of-digital-closeouts for rollout decisions.
- Read /resources/restaurant-cash-variance-investigation-guide for exception review.
- Use /run-pilot when the business case is ready for store testing.
How do teams build the Cost Case From Friction, Not Fantasy?
The safest cost case starts with work the restaurant leader can observe. Count the number of closeouts that require a second message, the number of deposit questions that reach finance, the number of cash difference notes that are too vague to review and the number of open issues still open after one business day.
Those measures are less dramatic than a broad savings claim, but they are more credible. A restaurant group can validate them from its own closeout records. A finance advisor can use them without pretending that every dollar of cash difference turns into recoverable cash.
The point is to show review drag. If managers, district leaders and finance teams spend time reconstructing the close, that work has a cost even when the shortage is small. The cost brief should make that burden visible without inventing a universal benchmark.
- Count follow-up events before assigning dollar savings.
- Separate missing proof from true cash difference.
- Measure review latency as a business cost, not as an inconvenience.
- Use the team's own records as the source for the pilot case.
How does a Conservative Worksheet for Closeout Drift work?
A conservative worksheet can use four inputs: average open issues per week, average minutes spent per issue, roles involved in follow-up and the number of cases that repeat across the same store or manager. Those inputs produce a practical estimate of review load without overstating financial recovery.
The worksheet should include a confidence column. Some numbers will be measured, some will be estimated from manager interviews and some will be unknown until the pilot starts. Labeling confidence protects the business case and keeps the model honest.
If the restaurant leader does not know the starting point, that is itself a finding. The first value of a pilot may be making the cost visible enough to discuss. A clean report can then show whether follow-up load, missing proof, or open issues improved after day 14.
- Use measured values when the record already shows the work.
- Use conservative estimates when the work happens in messages or calls.
- Mark unknown inputs instead of filling them with generic industry numbers.
- Compare the same worksheet before and after the pilot.
What to Leave Out of the Cost Case Model?
A credible cost case should leave out claims the restaurant leader cannot prove. Do not assume every cash difference dollar is recoverable. Do not assign a universal savings number to every manager follow-up. Do not claim that automation removes labor unless the pilot measures the time change.
Leaving those claims out makes the brief stronger. Finance buyers and advisory partners are used to inflated ROI language. A conservative model that names what is known, estimated and unknown earns more trust than a larger number built on weak assumptions.
The better question is whether the restaurant leader has enough review drag to justify a small pilot. If the answer is yes, the pilot can measure the real improvement and the business case can become sharper after evidence exists.
- Do not count every over-short dollar as recoverable savings.
- Do not invent labor savings without measured follow-up time.
- Do not combine proof chase, accounting cleanup and cash loss into one number.
- Do use the pilot to replace assumptions with restaurant leader-specific evidence.
Reference sources
Which public sources support this guide?
These public references support the recordkeeping, cash-control and tip-record context used across Tillzen resources. Tillzen does not give legal advice.
How do you turn the record into a rollout decision?
Map the current record, pick the first stores and measure whether review gets cleaner before rollout expands.
The work is real: 18 quick-service stores, 1,400+ hours given back annually, $1M+ in tip dollars reviewed annually, 18,000+ store closes annually and 3+ years supporting them.
- quick-service stores
- 18
- hours given back annually
- 1,400+
- tip dollars reviewed annually
- $1M+
- store closes annually
- 18,000+
- years supporting them
- 3+